Simplify Review
A web app that makes the most repetitive stages of a systematic review lighter (import, deduplication, filters and decision tracking) and always leaves the final word to the researcher.
The most rigorous method is also the slowest
Systematic reviews are the most reliable way to synthesise scientific evidence: explicit protocols, criteria stated in advance, every step replicable. This rigour is exactly what makes them costly. A single review can take months of work.
The early stages are the hardest: retrieving thousands of records from different databases, removing duplicates, aligning inconsistent metadata, applying the inclusion criteria and documenting every choice. Today this work moves from one tool to another, and every switch adds cognitive load and risk of error.
How do you find your way through the jungle of scientific research?
Core idea
A digital tool that does not replace the researcher but makes them more efficient.
Problem addressed
The cognitive load in the repetitive stages: deduplication, filtering and metadata management.
Goal
More transparency and traceability in decisions, for better-quality systematic reviews.
Listening to the people who do reviews every day
I followed a user-centred approach with mixed methods: a survey to measure habits, time spent and difficulties, and semi-structured interviews to understand motivations and frustrations. I cross-checked the two data sets with a thematic coding of the transcripts and I verified my interpretations with the participants (member-checking).
The sample: researchers, lecturers, PhD students and students of communication sciences and related fields, with different levels of experience. 72% had carried out at least one systematic review in the last two years.
Online survey
22 responses to the Italian version and 3 to the English one. Role, critical stages, screening hours, tools, expectations and fears about AI.
Semi-structured interviews
Seven guiding questions: from the last review carried out to the “ideal system”.
User profiles
Summarised in a map that combines experience and openness to AI.
Which tools do you use to manage the literature?
Multiple answers · Italian version, 22 responsesNo one uses software designed for reviews. The spreadsheet is still the main tool, also for tracking inclusion and exclusion decisions. This is the clearest sign that an integrated solution is missing.
spend between 10 and 20 hours screening articles; another 27.3% spend between 20 and 40 hours.
rate the difficulty of defining and applying inclusion and exclusion criteria as 4 out of 5.
would use AI-based tools, but only with a final human check on the decisions.
The chart and the 54.5% and 68.2% figures refer to the 22 responses to the Italian version of the survey.
I am afraid of introducing variables I cannot control. If an article is excluded, I must be able to explain the reason clearly.
I used ChatGPT to help me rephrase the research question and to summarise some texts. Useful, but I always have to correct it.
I worry that AI oversimplifies. I need to preserve the cultural nuances in the texts.
User attitude map
5 profiles · experience and openness to AI, scale 1–5More experience, more caution
The profiles with the most methodological experience are also the least willing to rely on automation; younger researchers are the most open to experimenting. The tool had to convince both: fast for those who want to automate, transparent for those who must justify every choice.
Pain points
- Inconsistent metadata
- Duplicates across databases
- Unclear criteria
- Tools that lack transparency
Needs
- Simplicity
- Clarity
- Reliability
- Replicability
From needs to four design principles
I turned the findings into functional and non-functional requirements. Four principles guided every interface choice.
The system suggests, the researcher decides
Every merge of duplicates and every exclusion needs a confirmation. Automation speeds things up, but it does not decide for the person who signs the review.
No black boxes
Deduplication rules and filters are always visible and editable. Future AI features will show confidence indicators and the reason for each suggestion.
Every choice leaves a trace
An audit trail records the date, reviewer and reason for each decision, and provides the counts for the PRISMA diagram.
Open formats, no lock-in
Import from CSV, XLS and RIS with templates for PubMed, Scopus, Web of Science and Cochrane; export to RIS, BibTeX and EndNote XML.
Non-functional requirements: short explanatory texts and actions that can be undone, stable performance even with thousands of records, privacy by design under the GDPR, and a modular architecture to add AI and collaboration in later versions.
From paper to Framer, one level of fidelity at a time
I developed the prototype step by step (fidelity escalation): paper to explore the structure quickly, Miro to connect the flows, Figma for the high-fidelity interface and Framer to publish it as a clickable prototype for users to try.
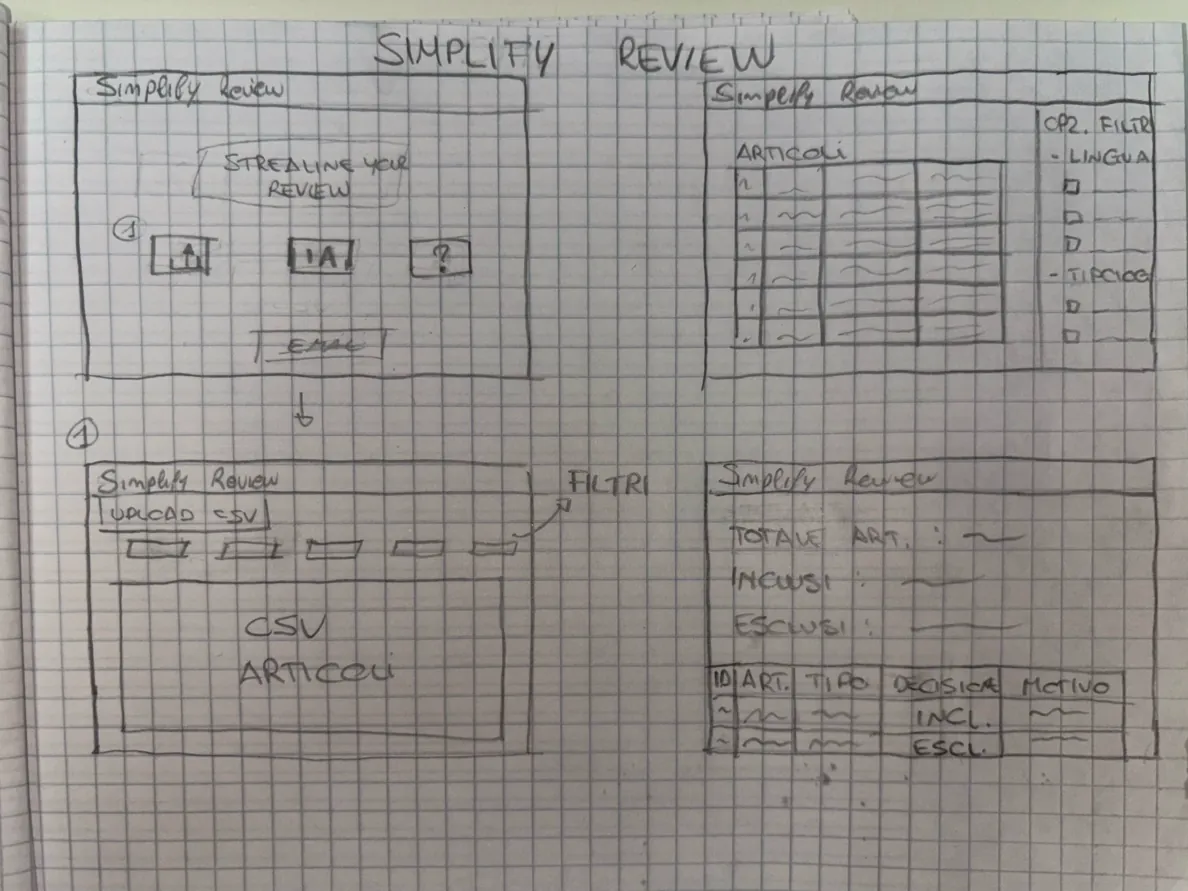
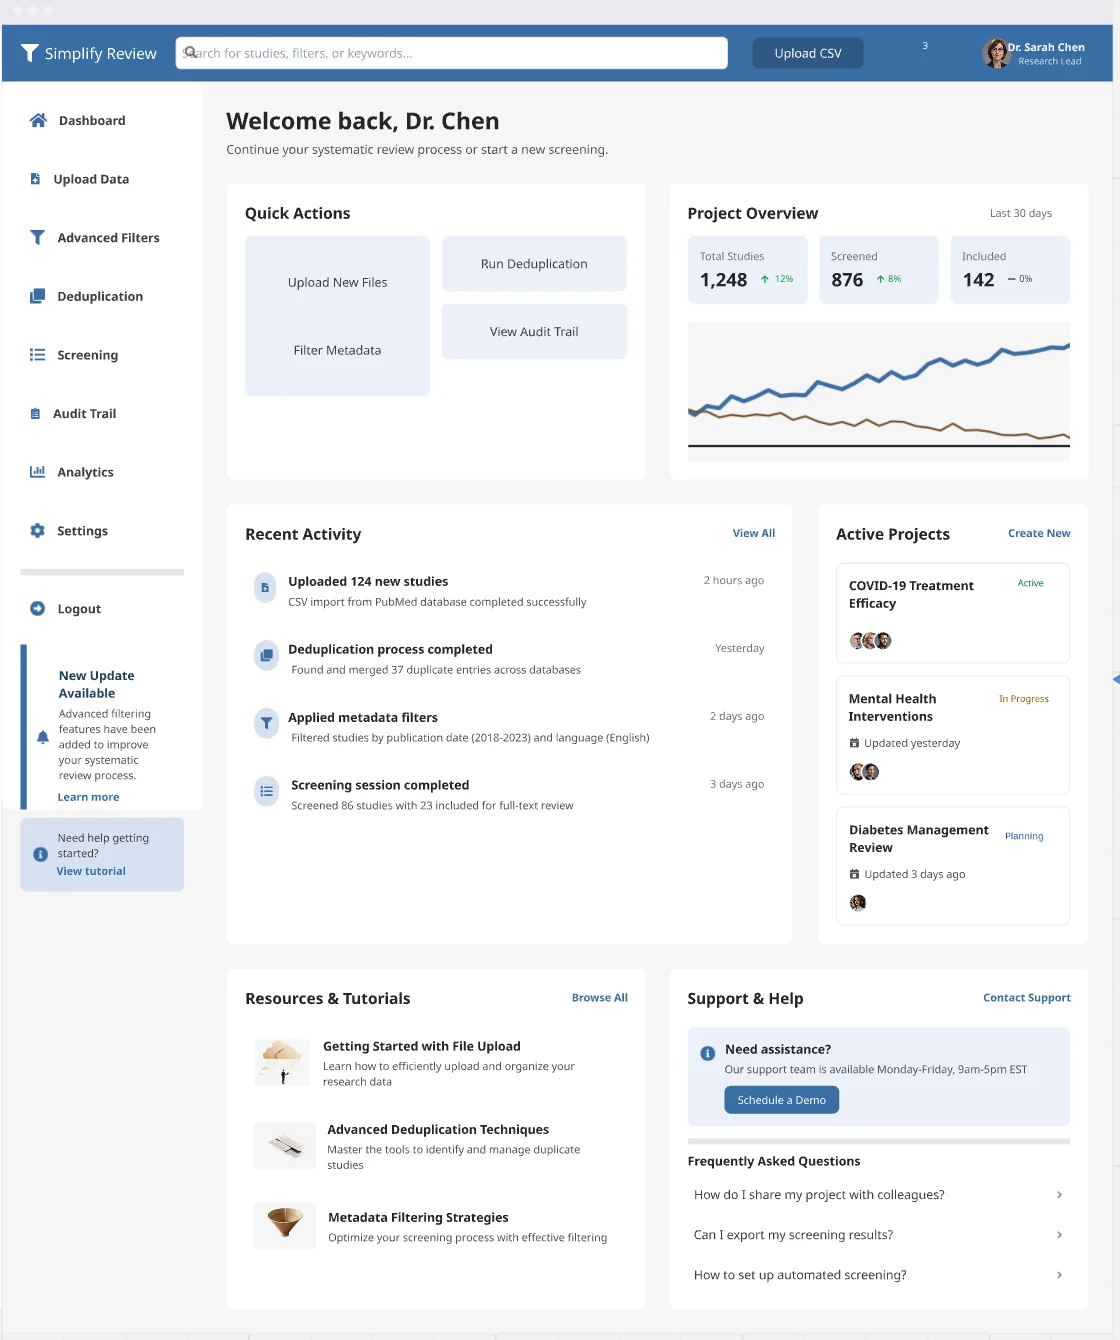
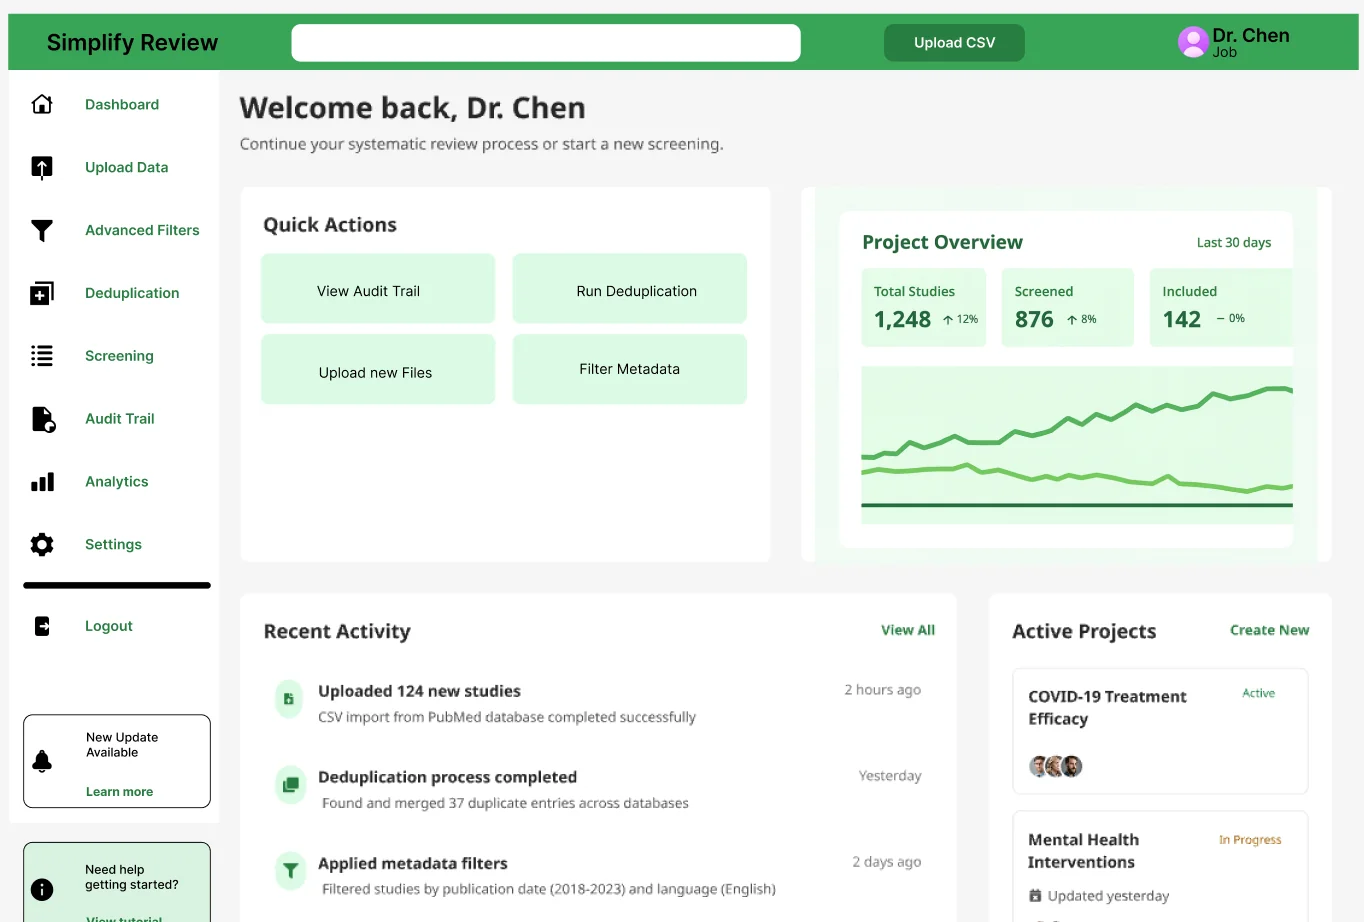
Prototype scope: version 1.2 of the roadmap, with upload, deduplication, metadata filters and audit trail. It is front-end only: the flows are simulated, with no back end that really processes the files.
One single environment for the early stages of a review
The navigation follows the real order of the work. Each step shows its status and leads to the next one, so the researcher always knows where they are and how much evidence is still left to assess.
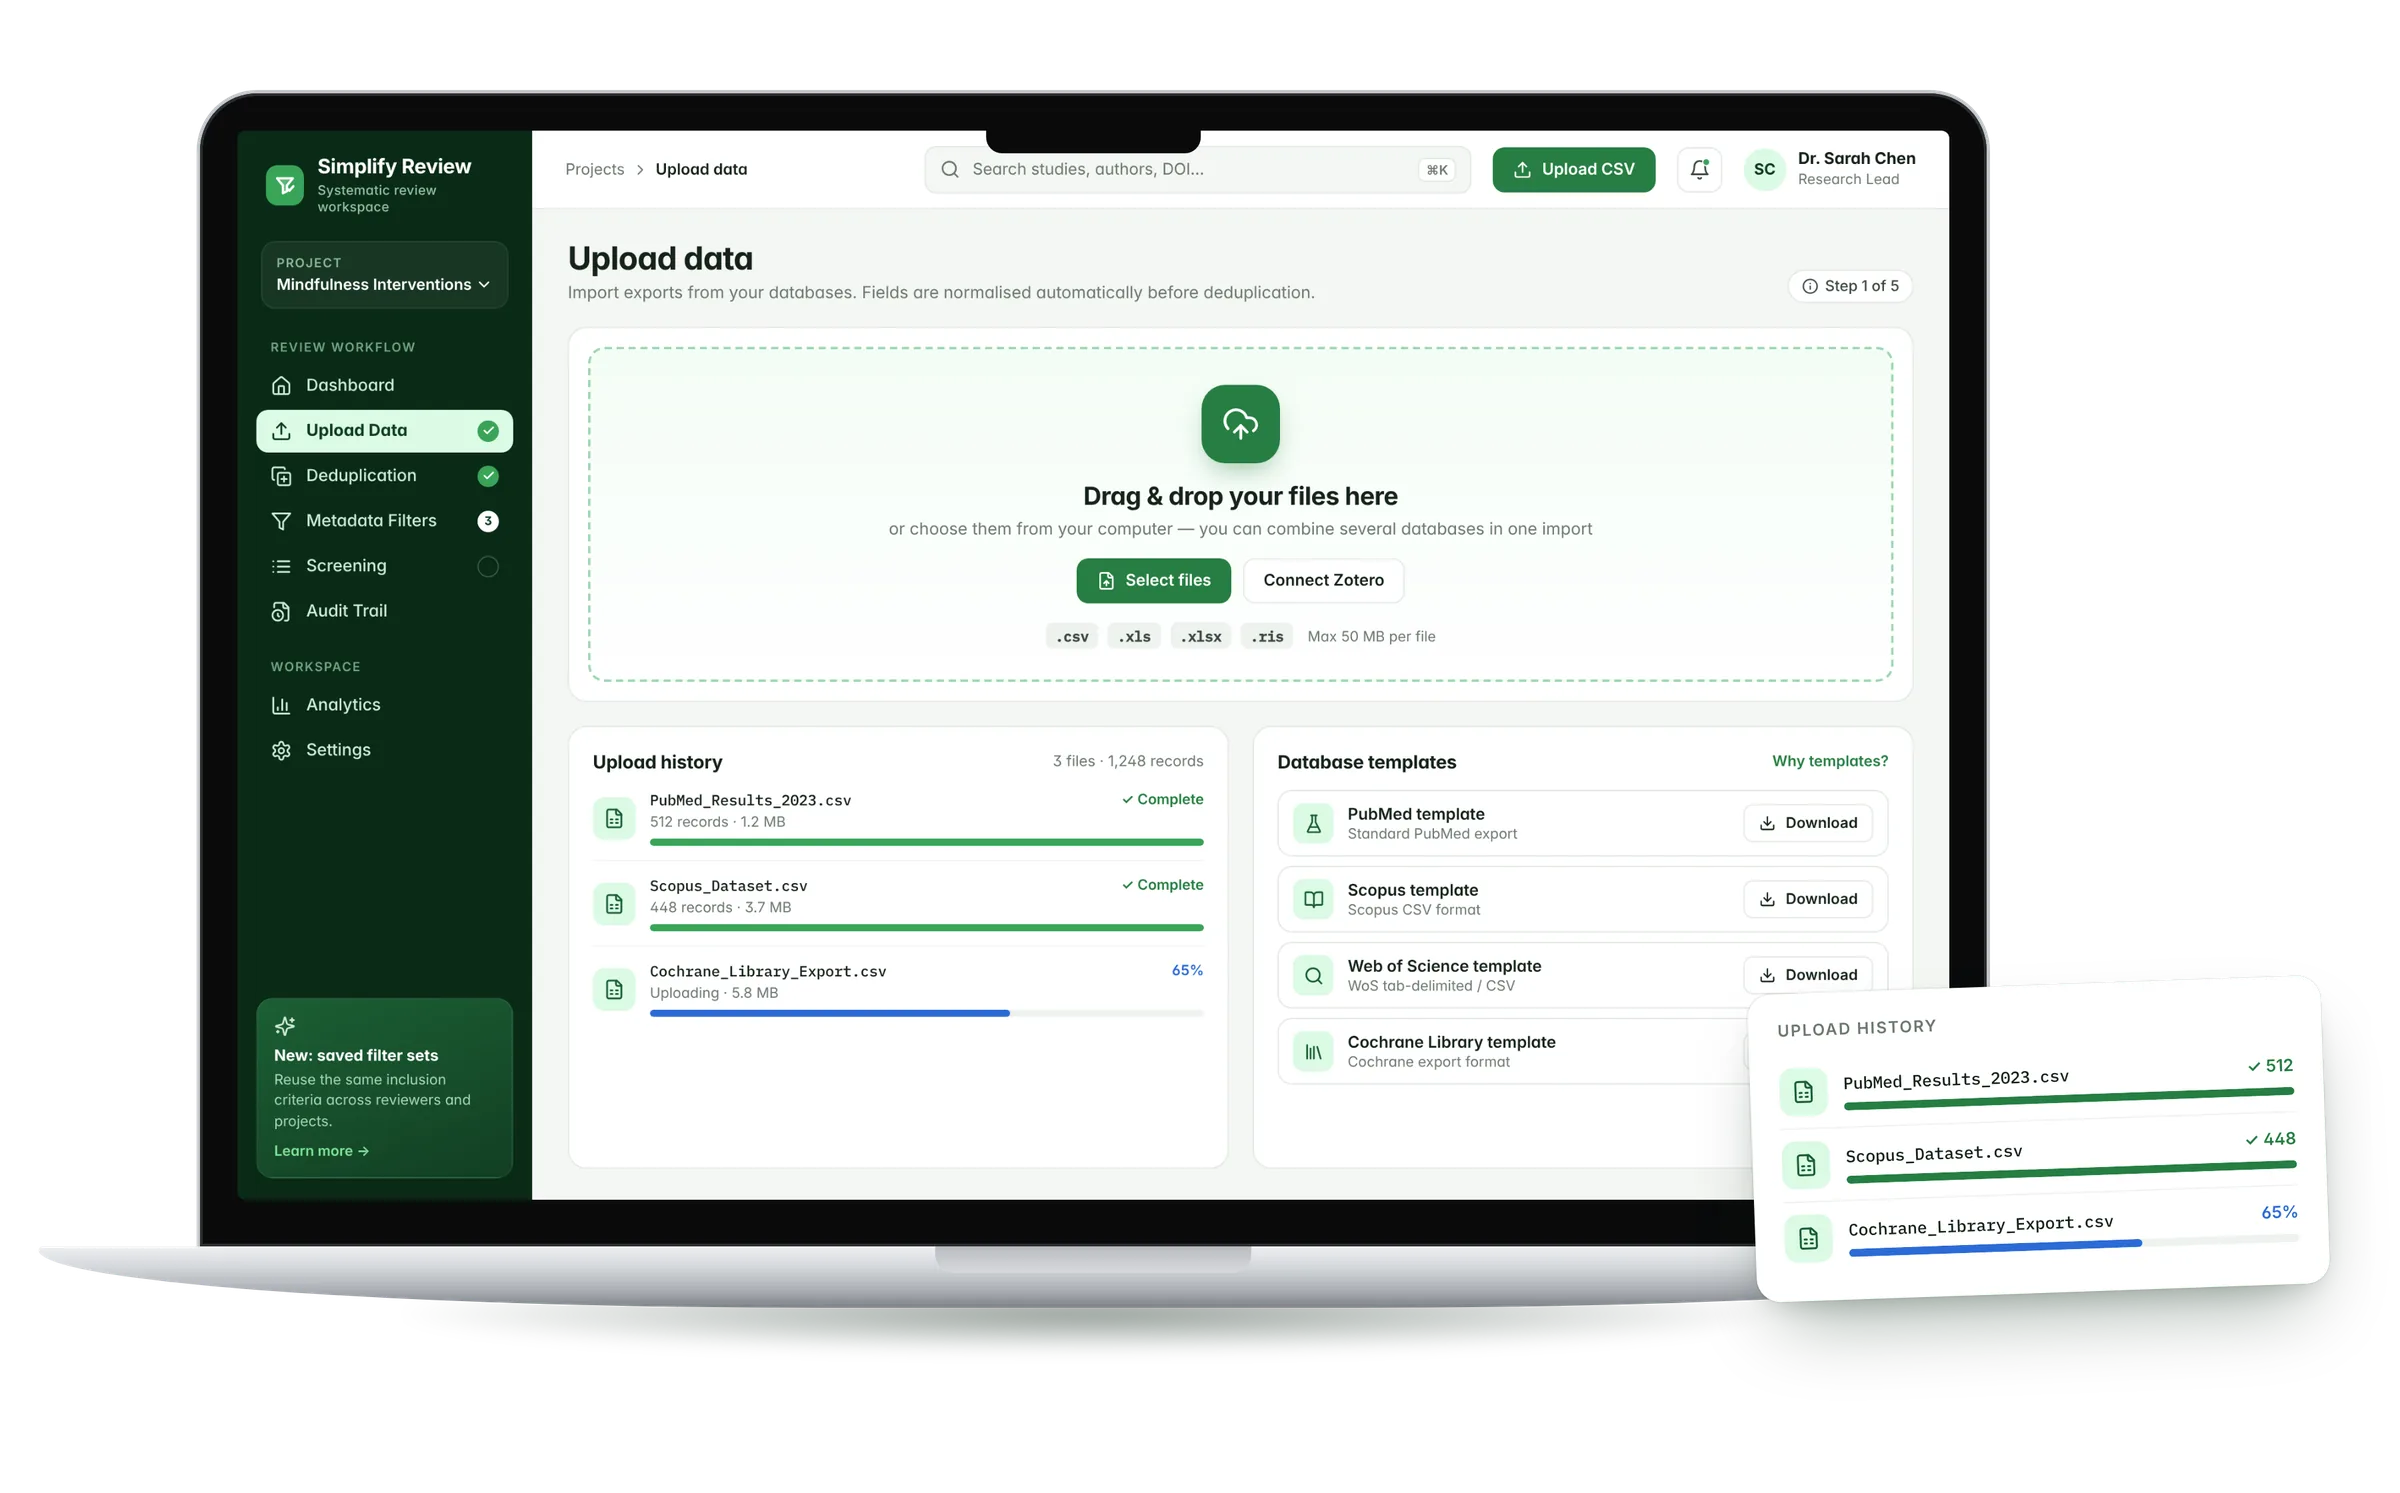
All sources in a single import
You drag in the files exported from the databases and combine several sources together. The fields are normalised before deduplication.
- Templates for PubMed, Scopus, Web of Science and Cochrane
- Progress status and number of records for each file
- Accepted formats: CSV, XLS, XLSX, RIS
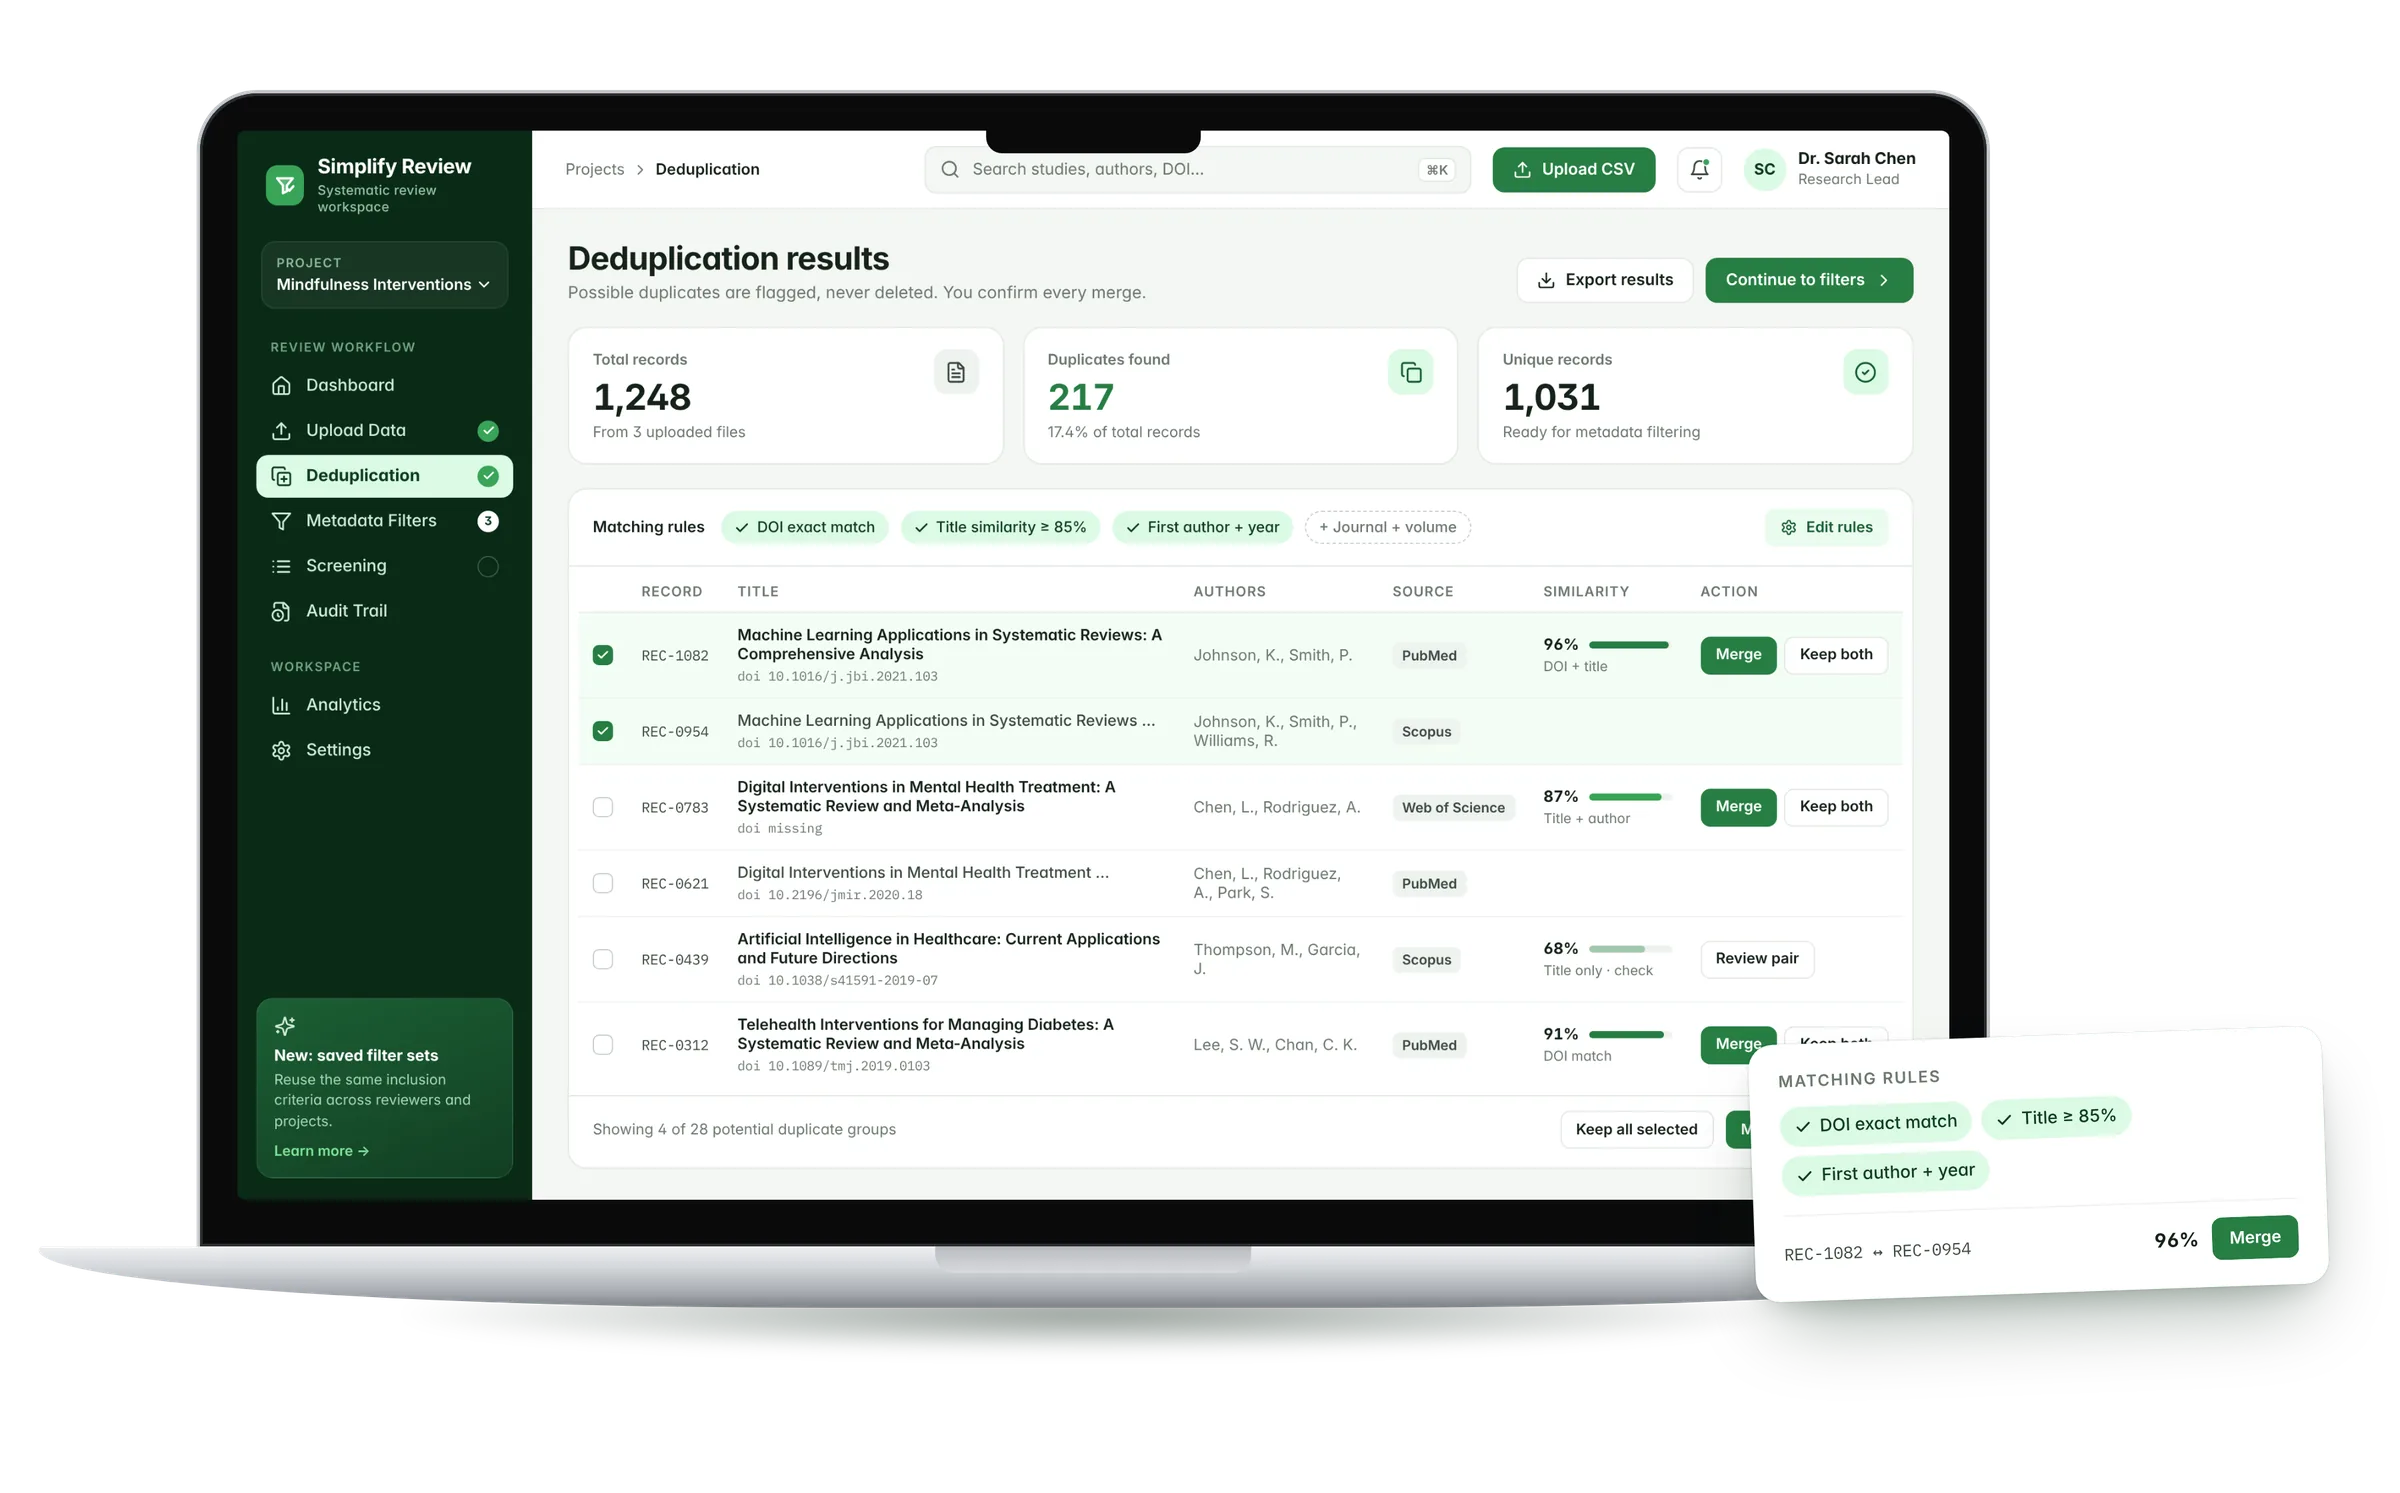
Duplicates are flagged, not deleted
The system compares DOI, title and authors and suggests possible duplicate pairs with a similarity percentage. The researcher always decides.
- Matching rules that are visible and editable
- “Merge” and “Keep both” actions on each pair
- Summary: total records, duplicates, unique records
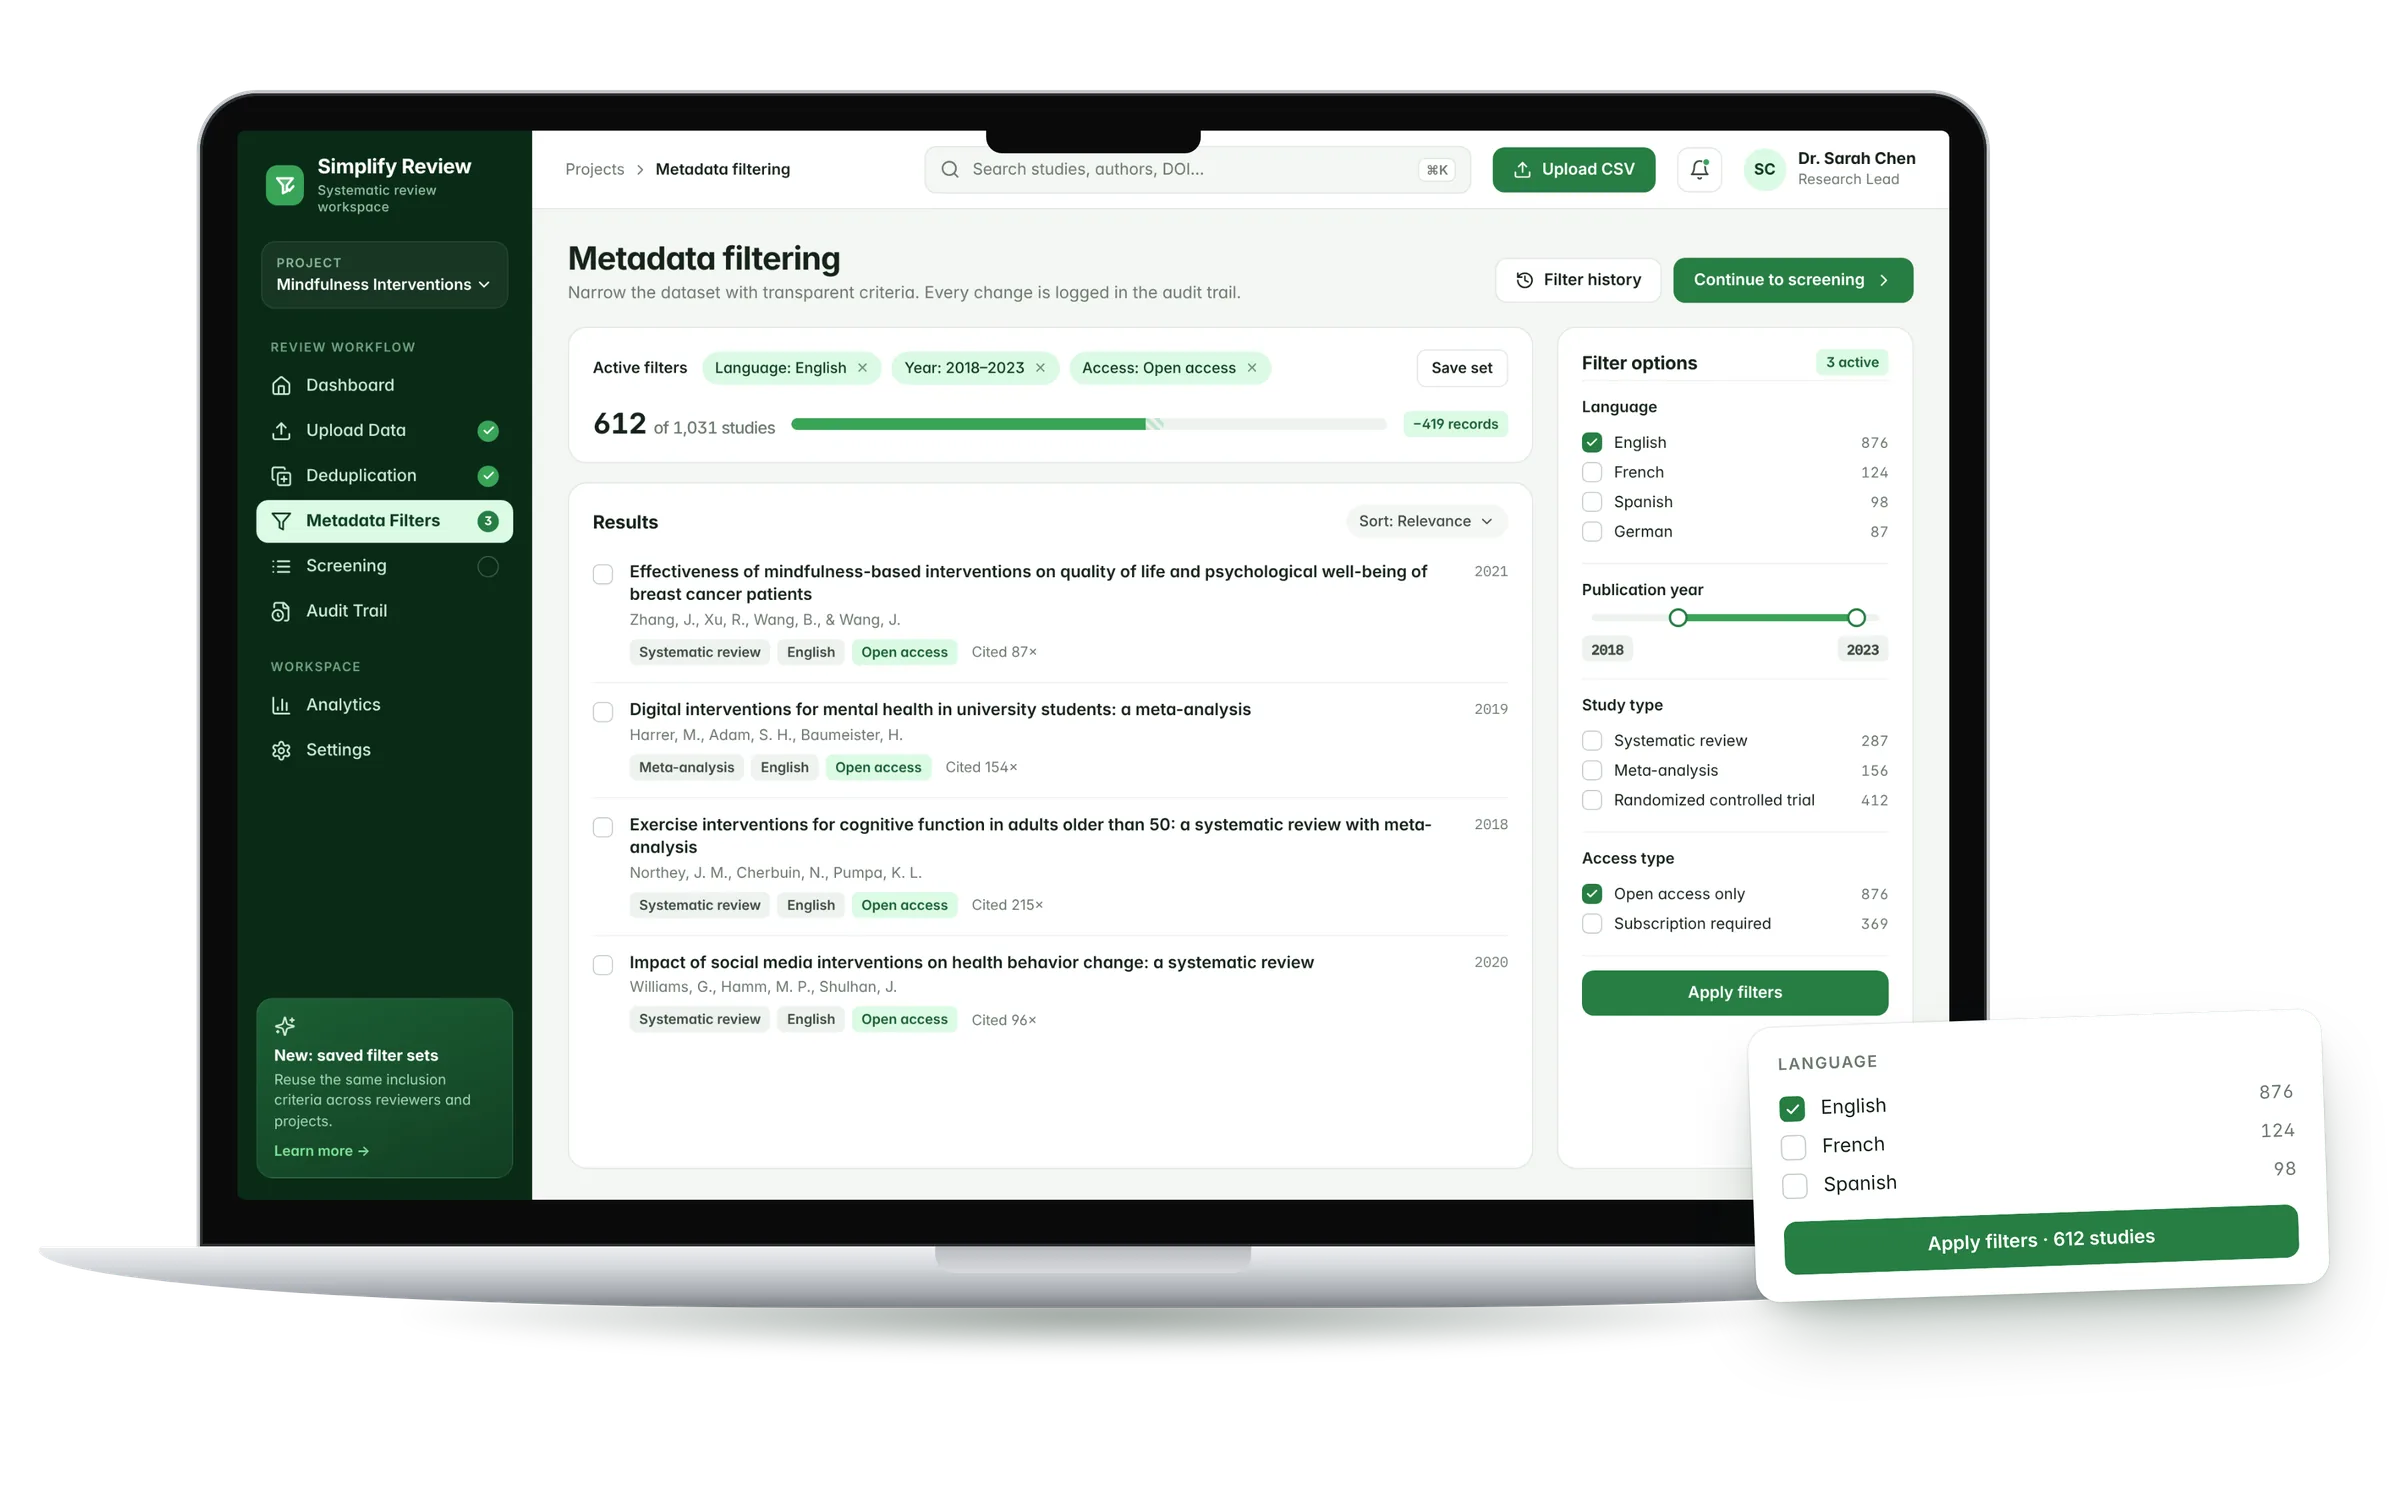
See the effect of each criterion straight away
Language, year, study type and open access can be combined as filters. The number of studies updates while you choose.
- Active filters highlighted, removable with one click
- Filter sets that can be saved and reused across reviewers
- Every change goes into the audit trail
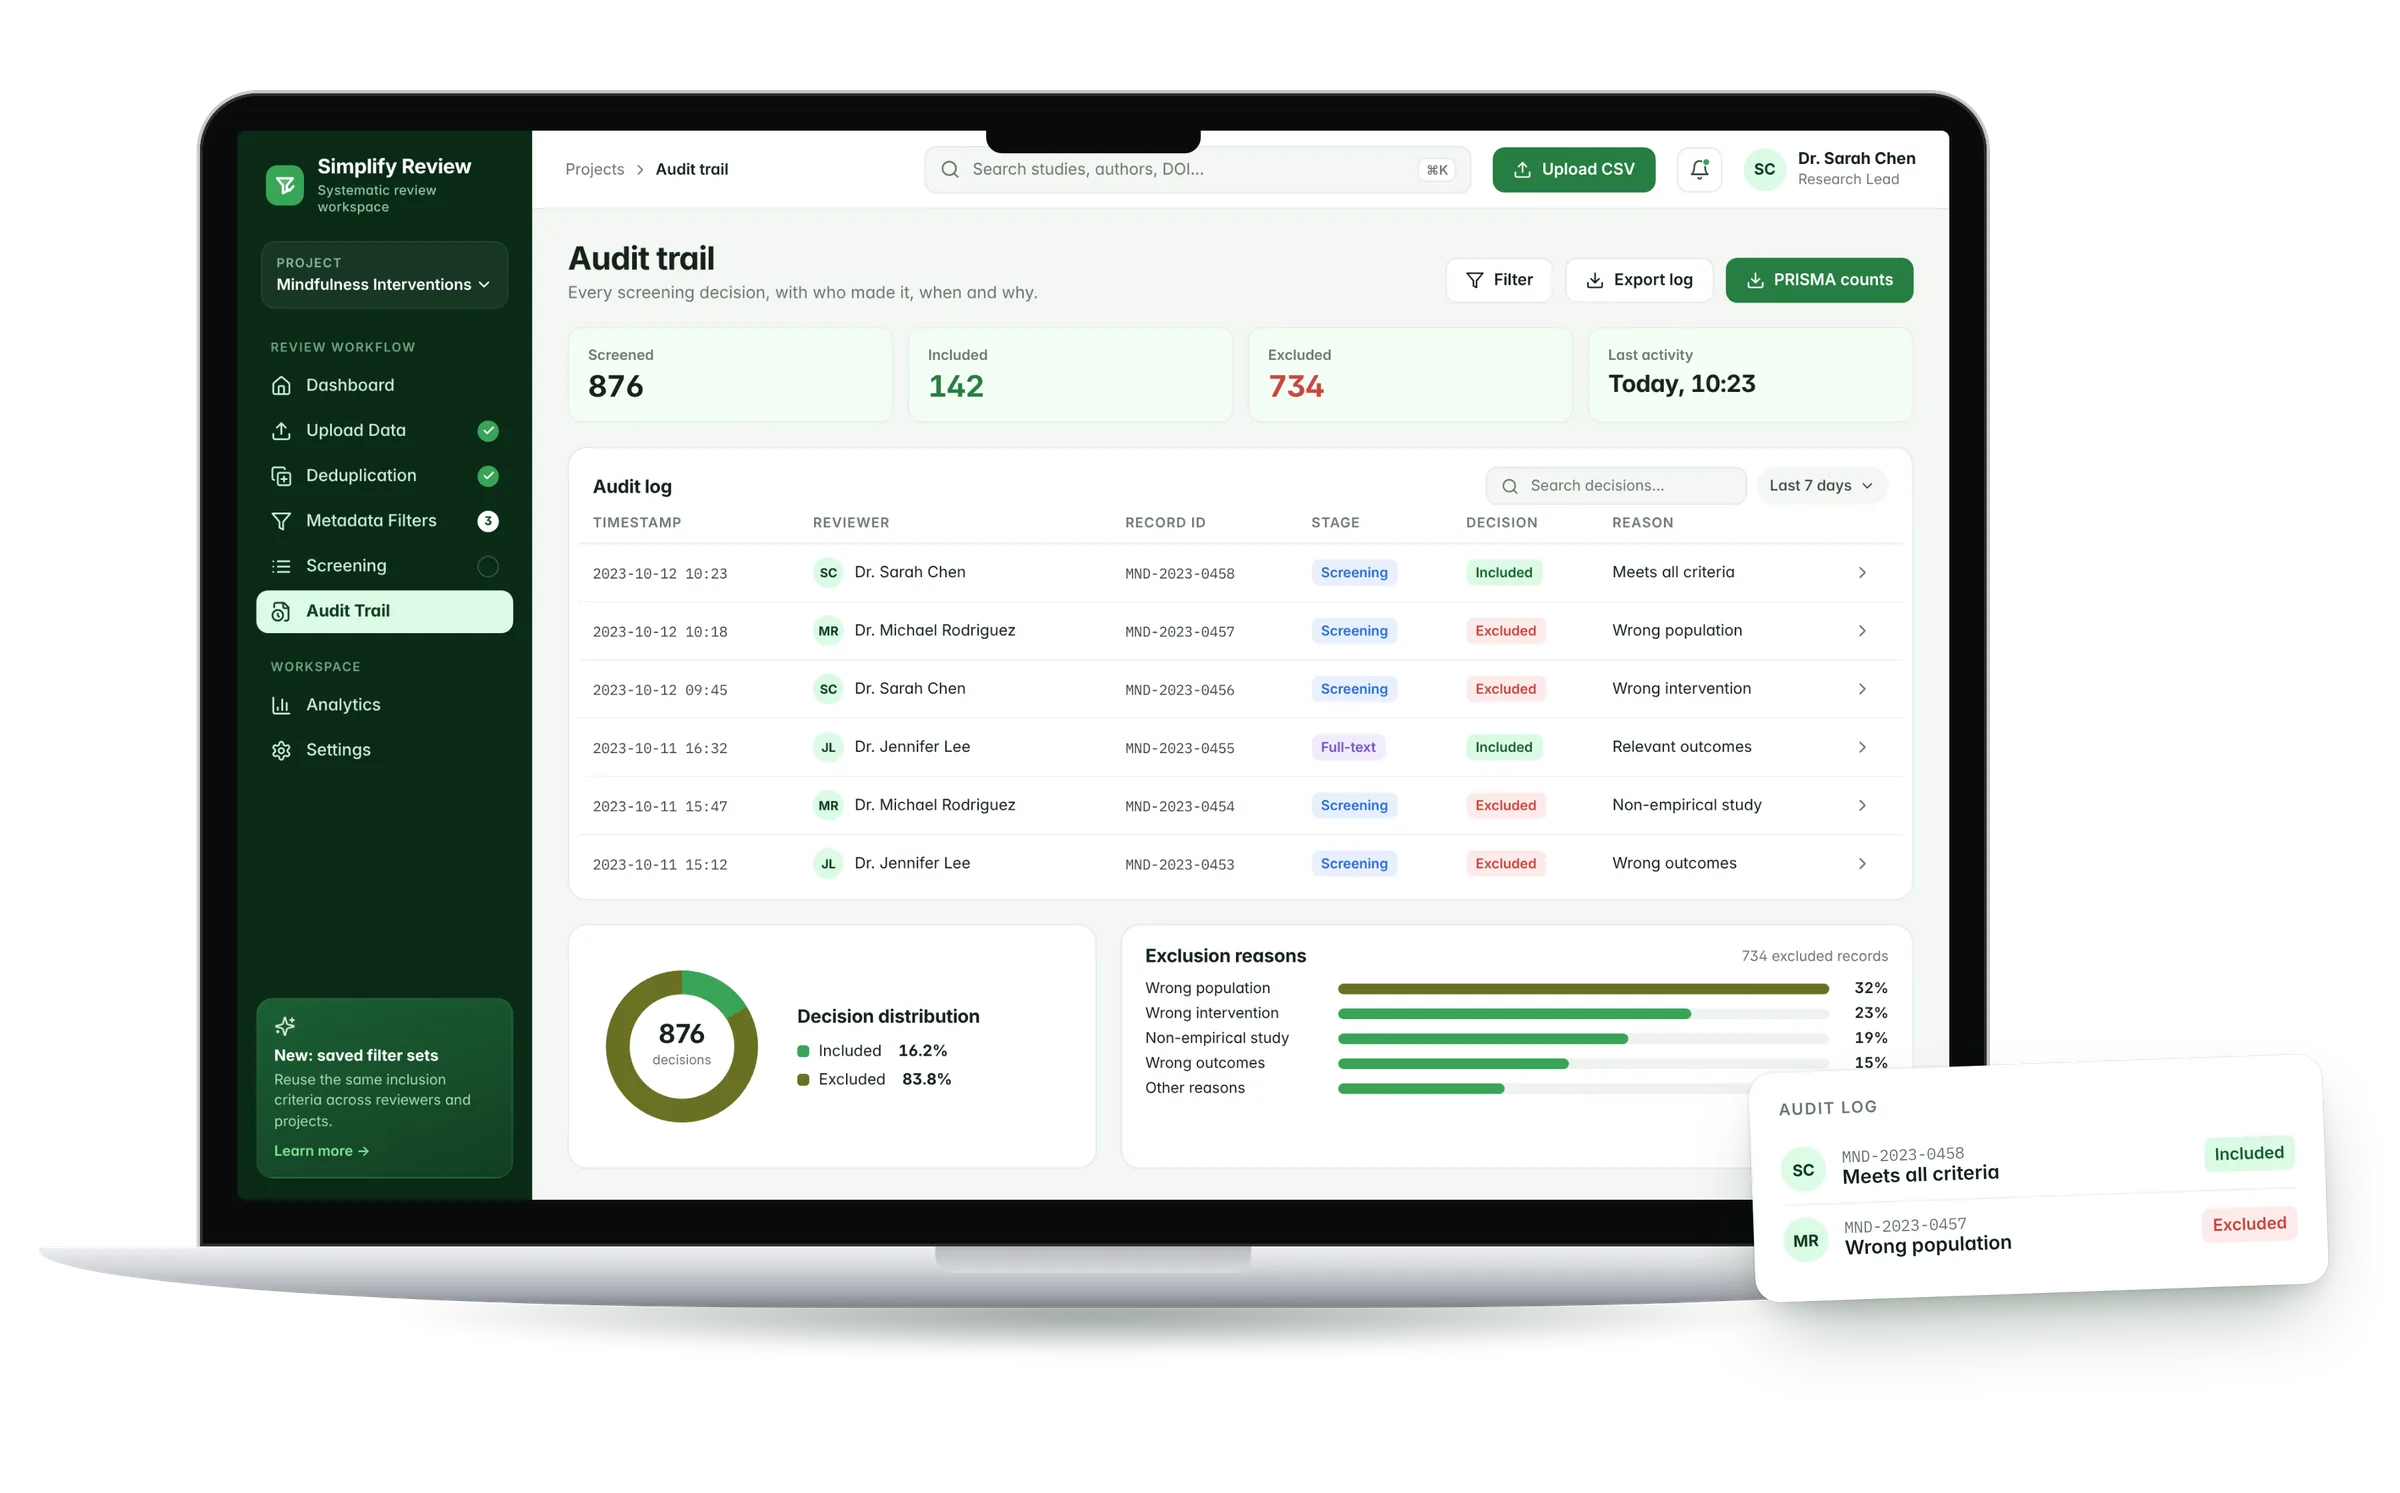
Every decision has an author and a reason
The log records who included or excluded each record, when and why. Charts summarise the choices, and the counts can be exported for the PRISMA diagram.
- Stage, decision and reason for each record
- Distribution of decisions and reasons for exclusion
- Export of the log and the PRISMA counts
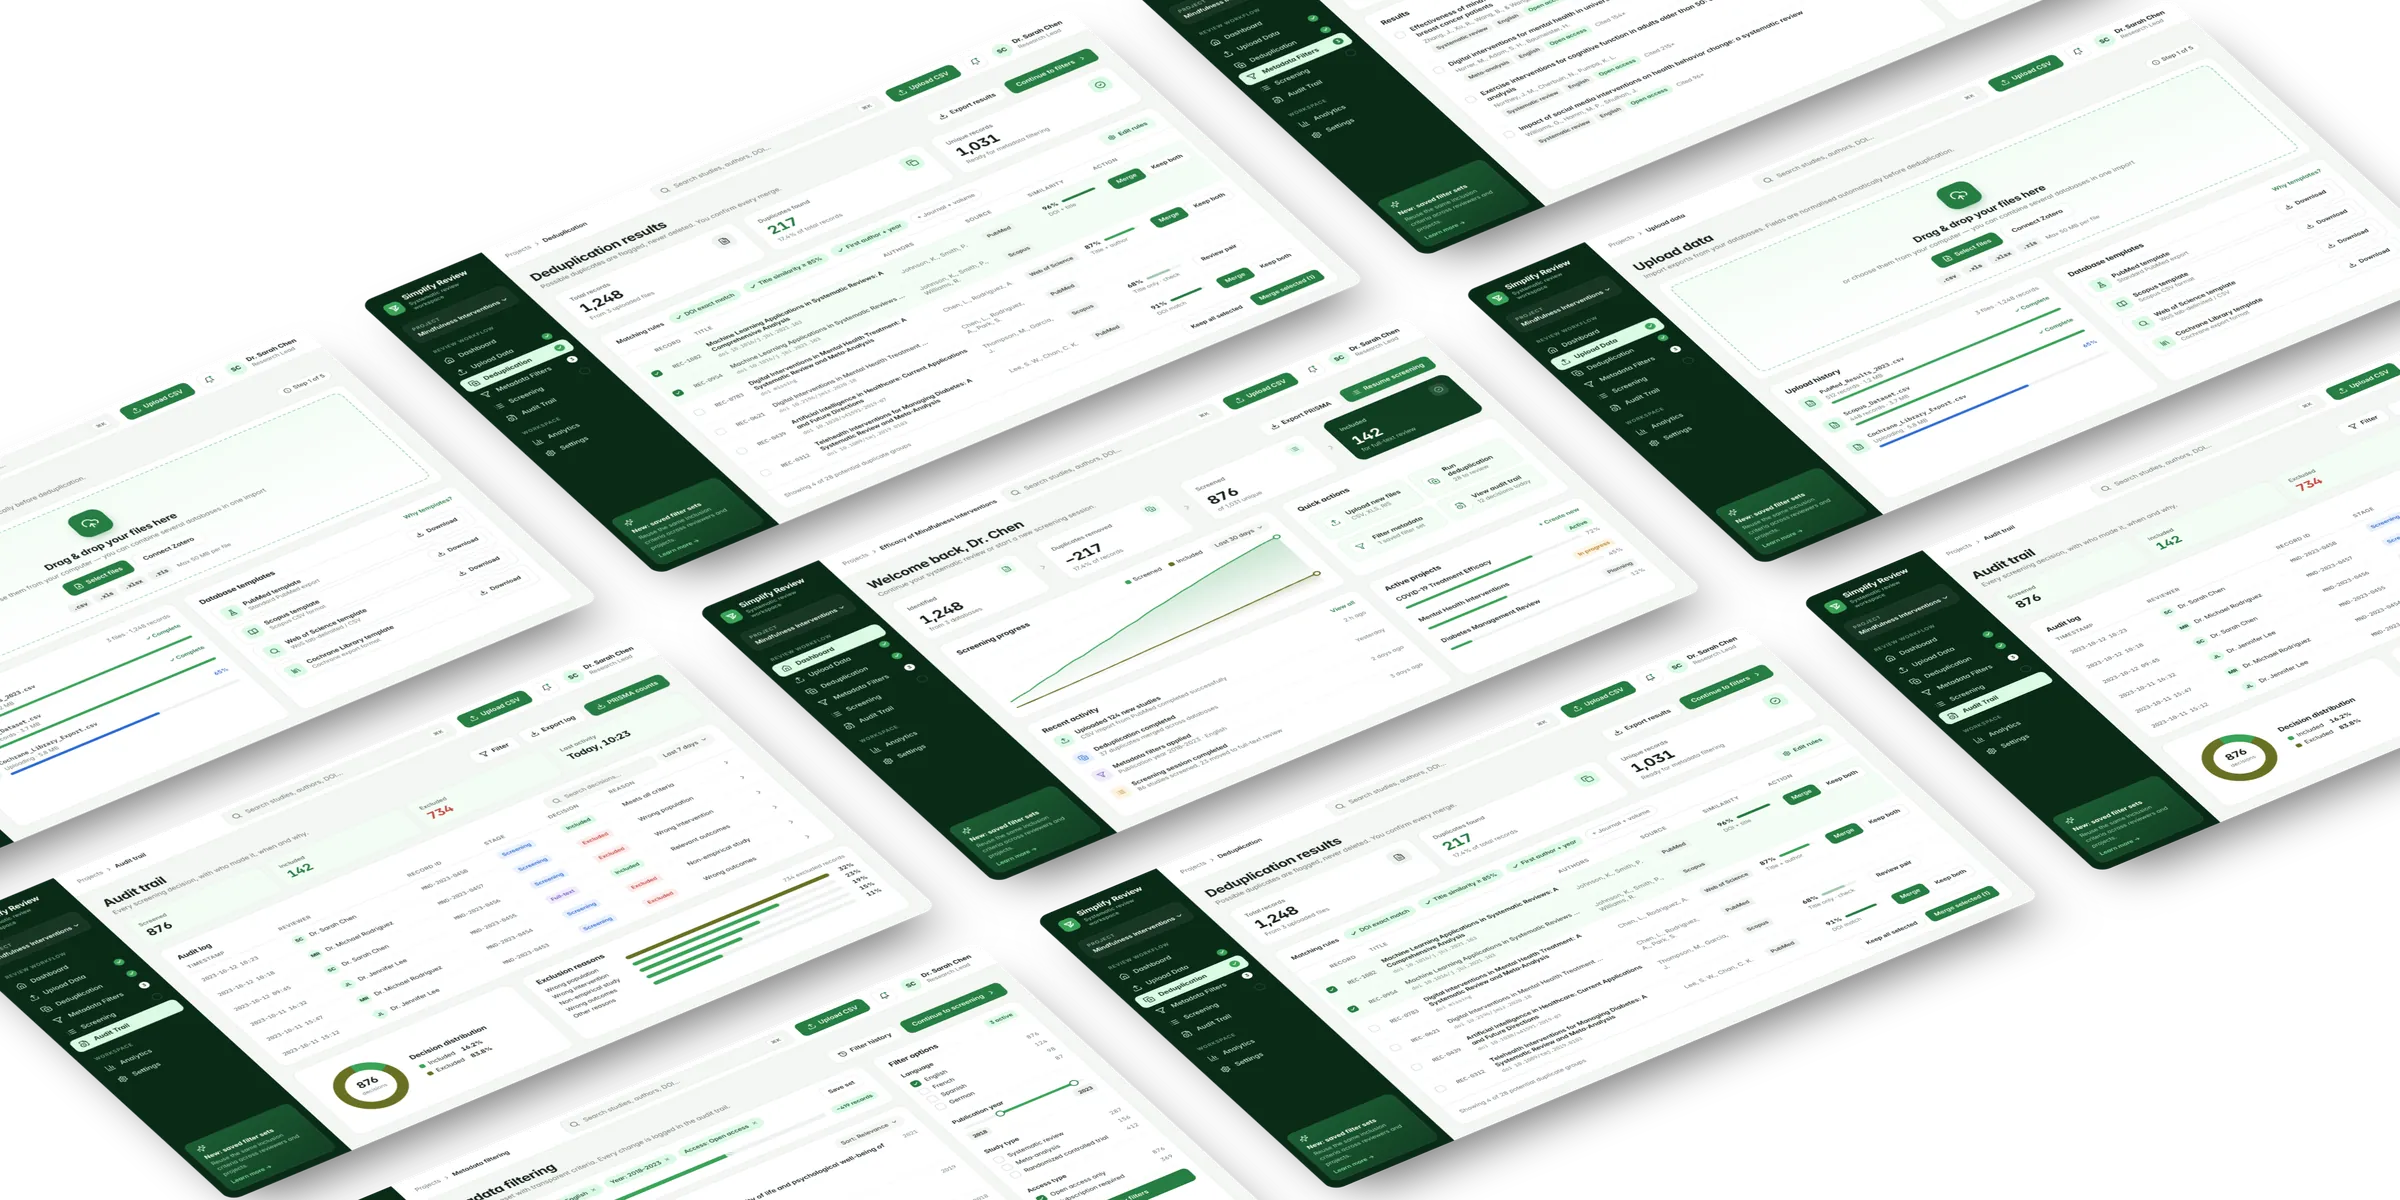
Five screens, one continuous flow
Dashboard, upload, deduplication, filters and audit trail share the same sidebar, the same components and the same status logic.
Clear and intuitive, but not yet distinctive
I evaluated the Framer prototype with AttrakDiff, a questionnaire that uses pairs of opposite adjectives, on a scale from 1 to 7, to measure both usability and the quality of the experience. 20 researchers and students with different levels of experience with digital review tools took part.
Mean scores by dimension
AttrakDiff · n = 20 · scale 1–7Pragmatic qualityPQ · clear, intuitive, functional
Overall attractivenessATT · overall judgement
Hedonic quality · stimulationHQ-S · innovative, engaging
Hedonic quality · identityHQ-I · sense of belonging
Complicated ↔ Simple
n = 2016 out of 20rated the interface as simple, with a score of 6 or 7.
All dimensions are above the neutral value. The highest score is for usability; the lowest is for identity: the prototype showed little character of its own. In the thesis I linked this to the still very basic look of the front end and to the lack of personalisation.
After the test: more identity, same clarity
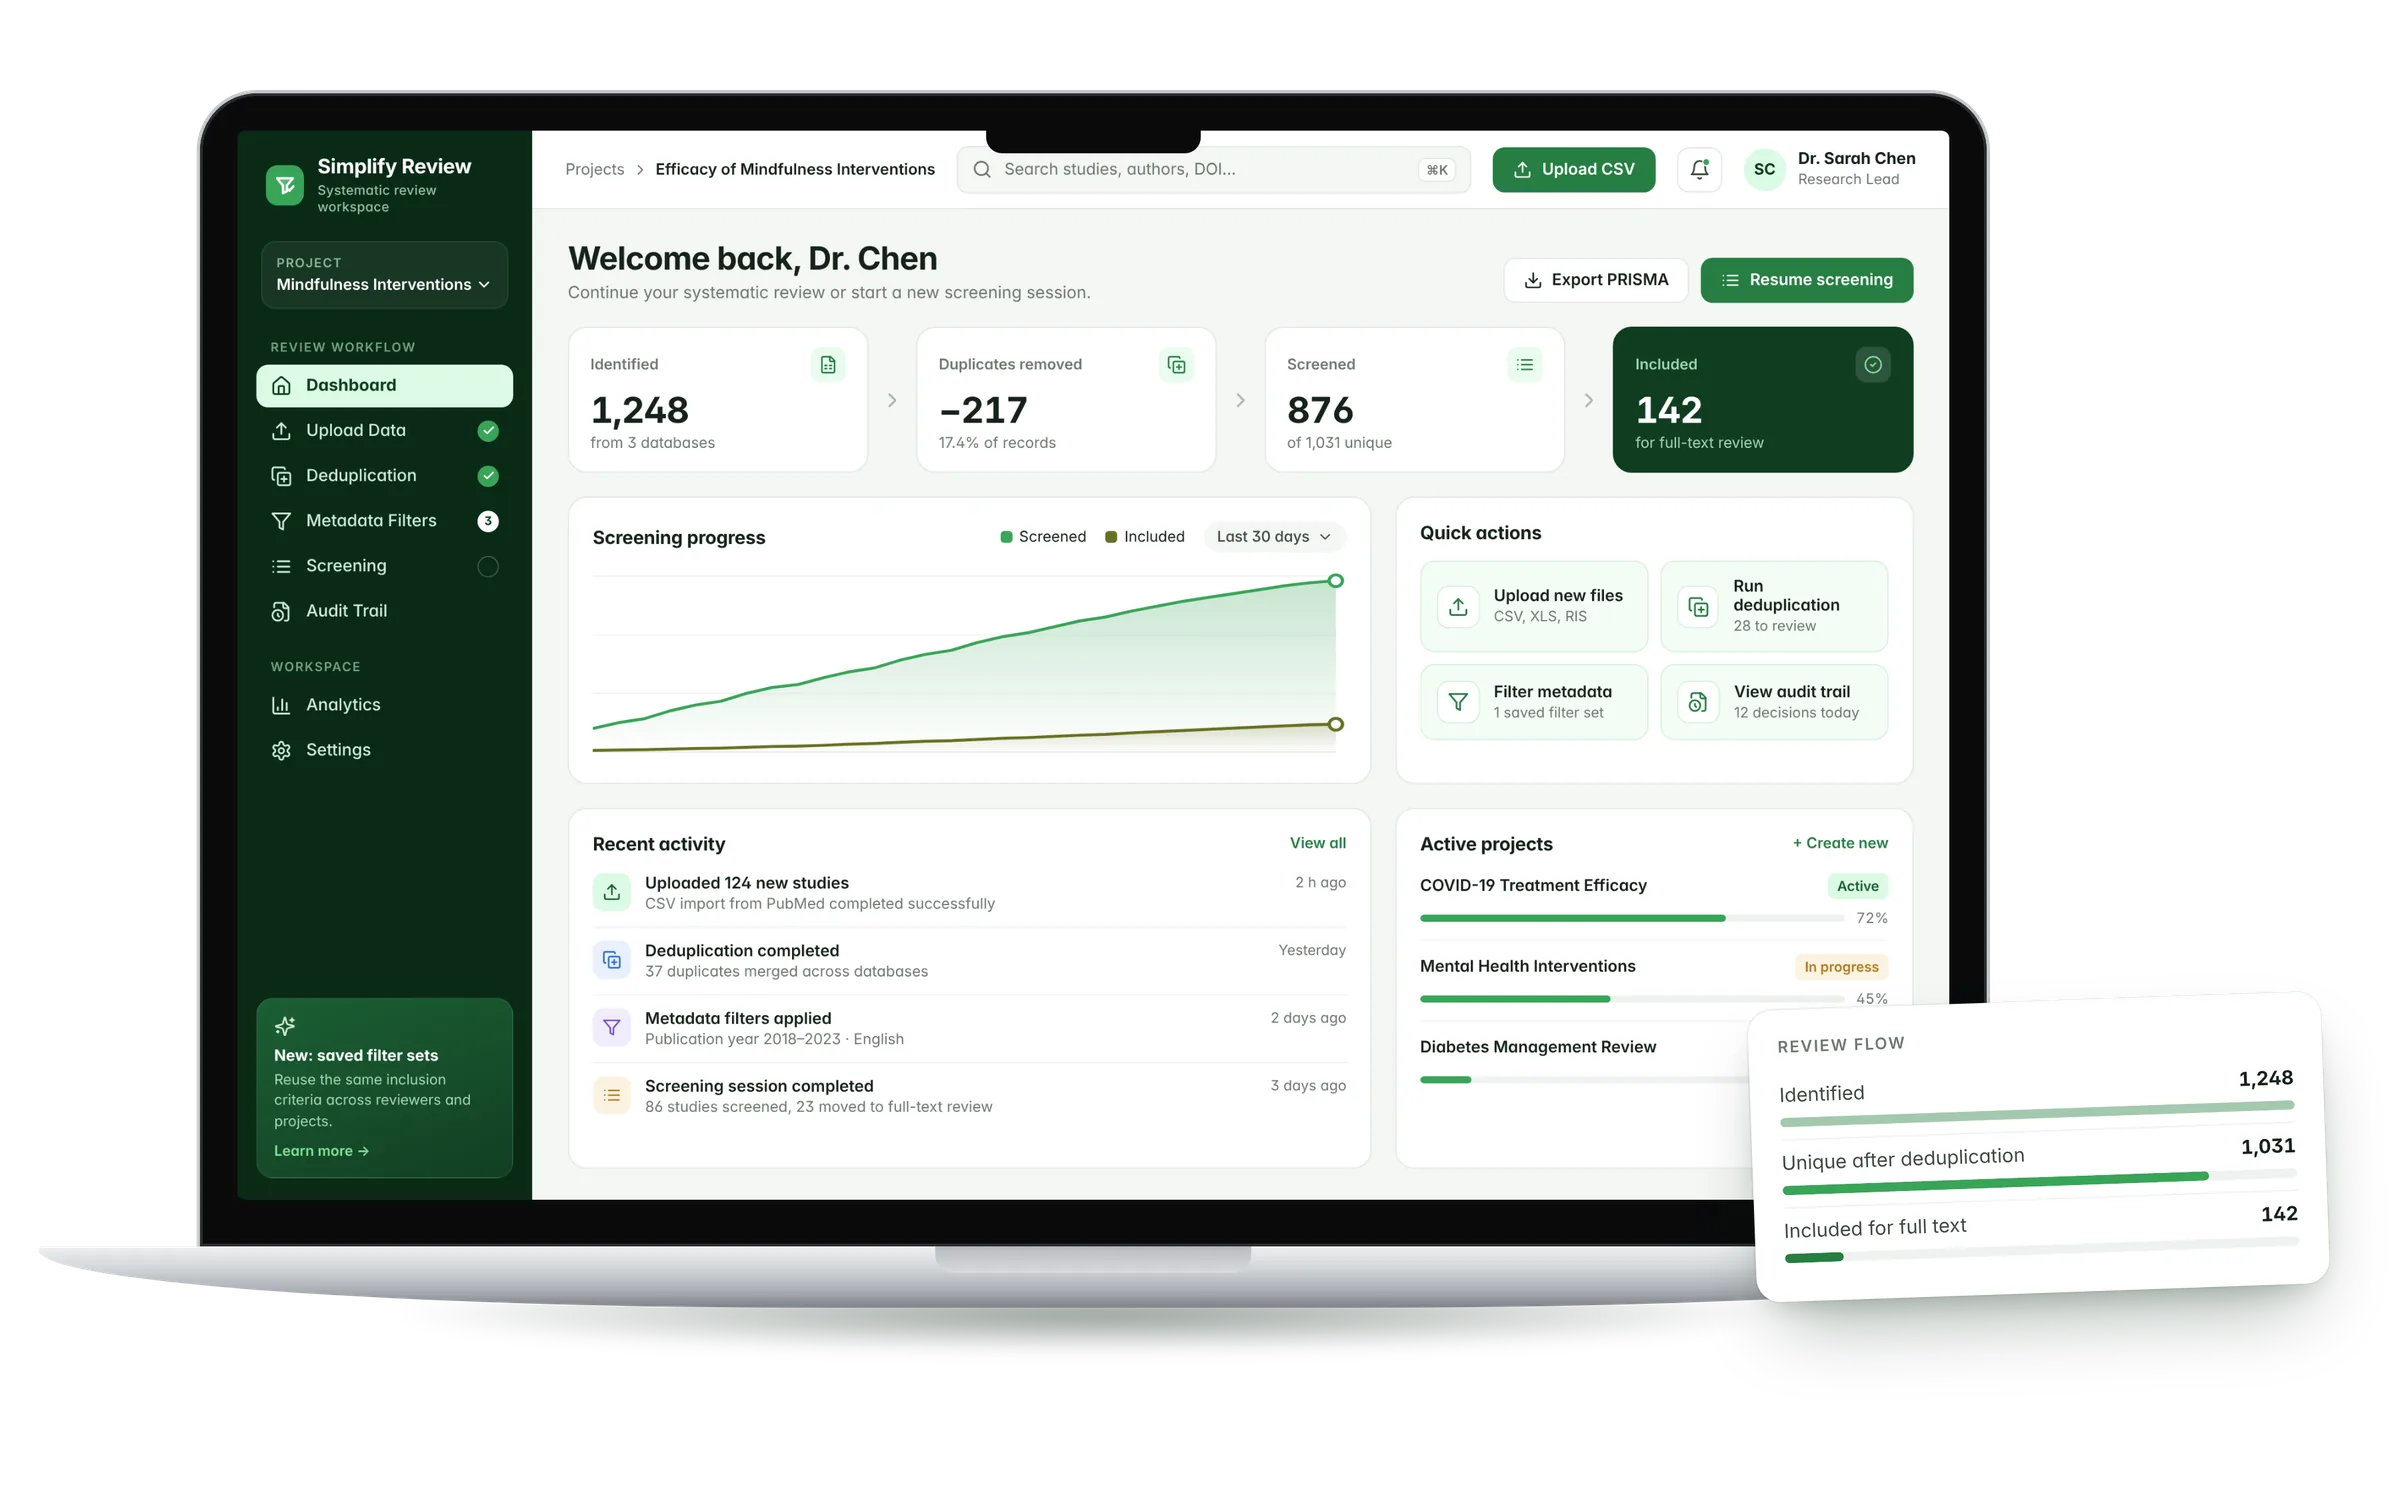
For this portfolio I went back to the prototype, starting from the lowest score. I kept the green palette and the screen architecture, and I worked on hierarchy, states and visual identity. Drag the slider to compare the dashboard before and after.
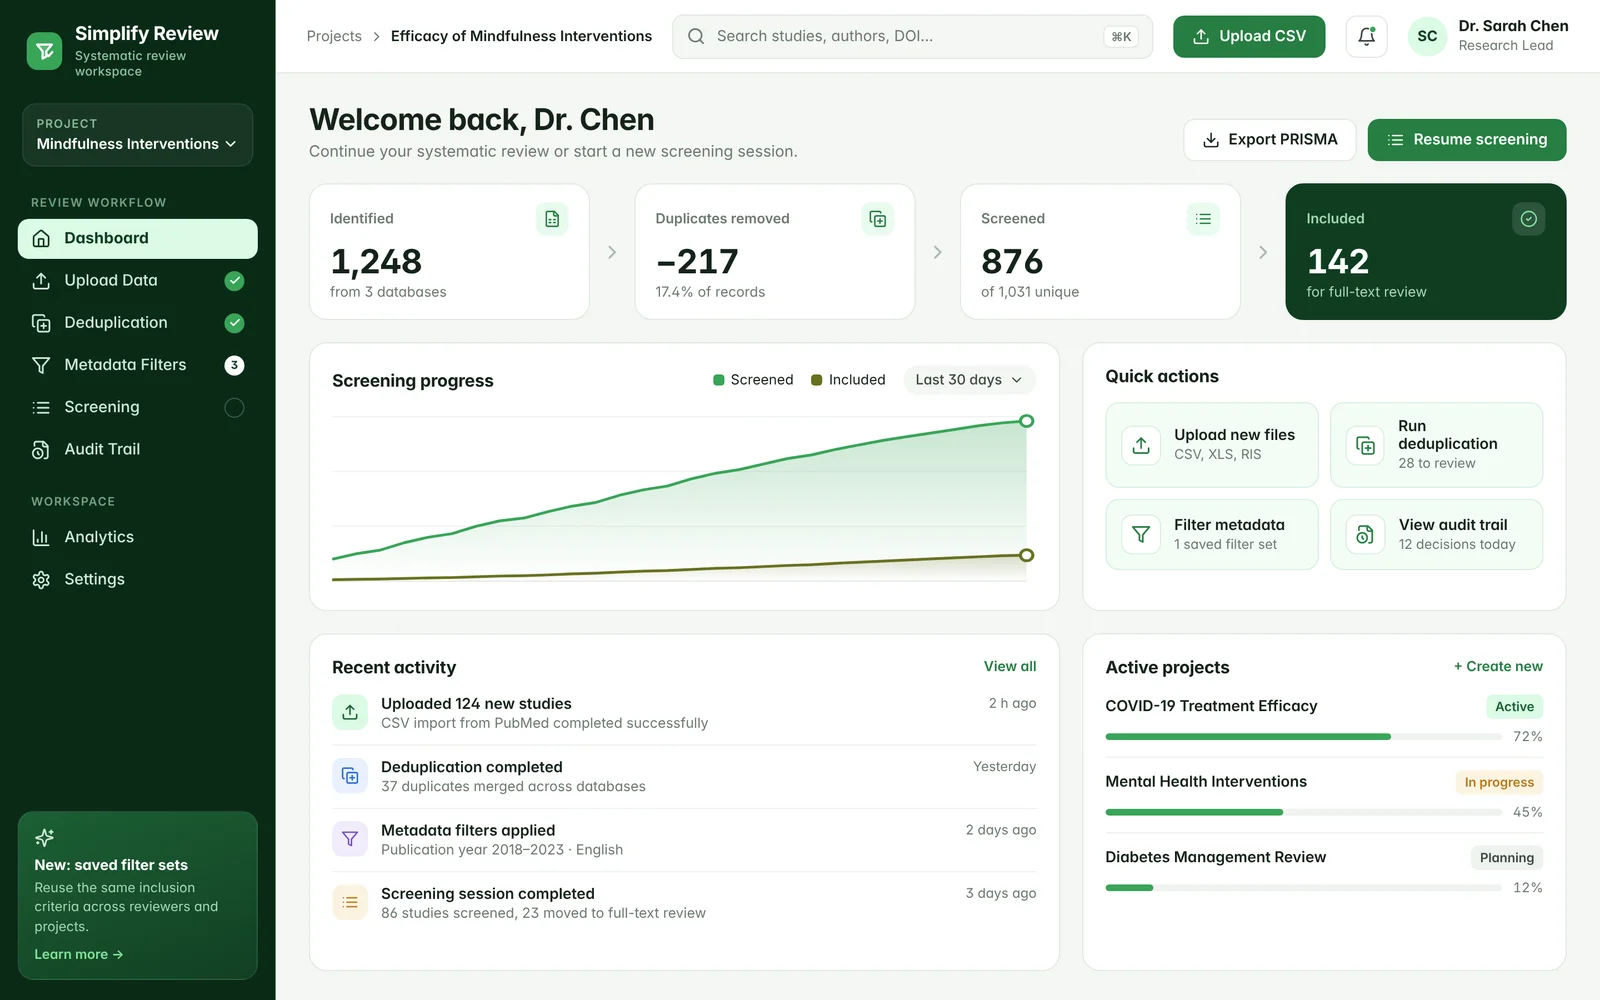
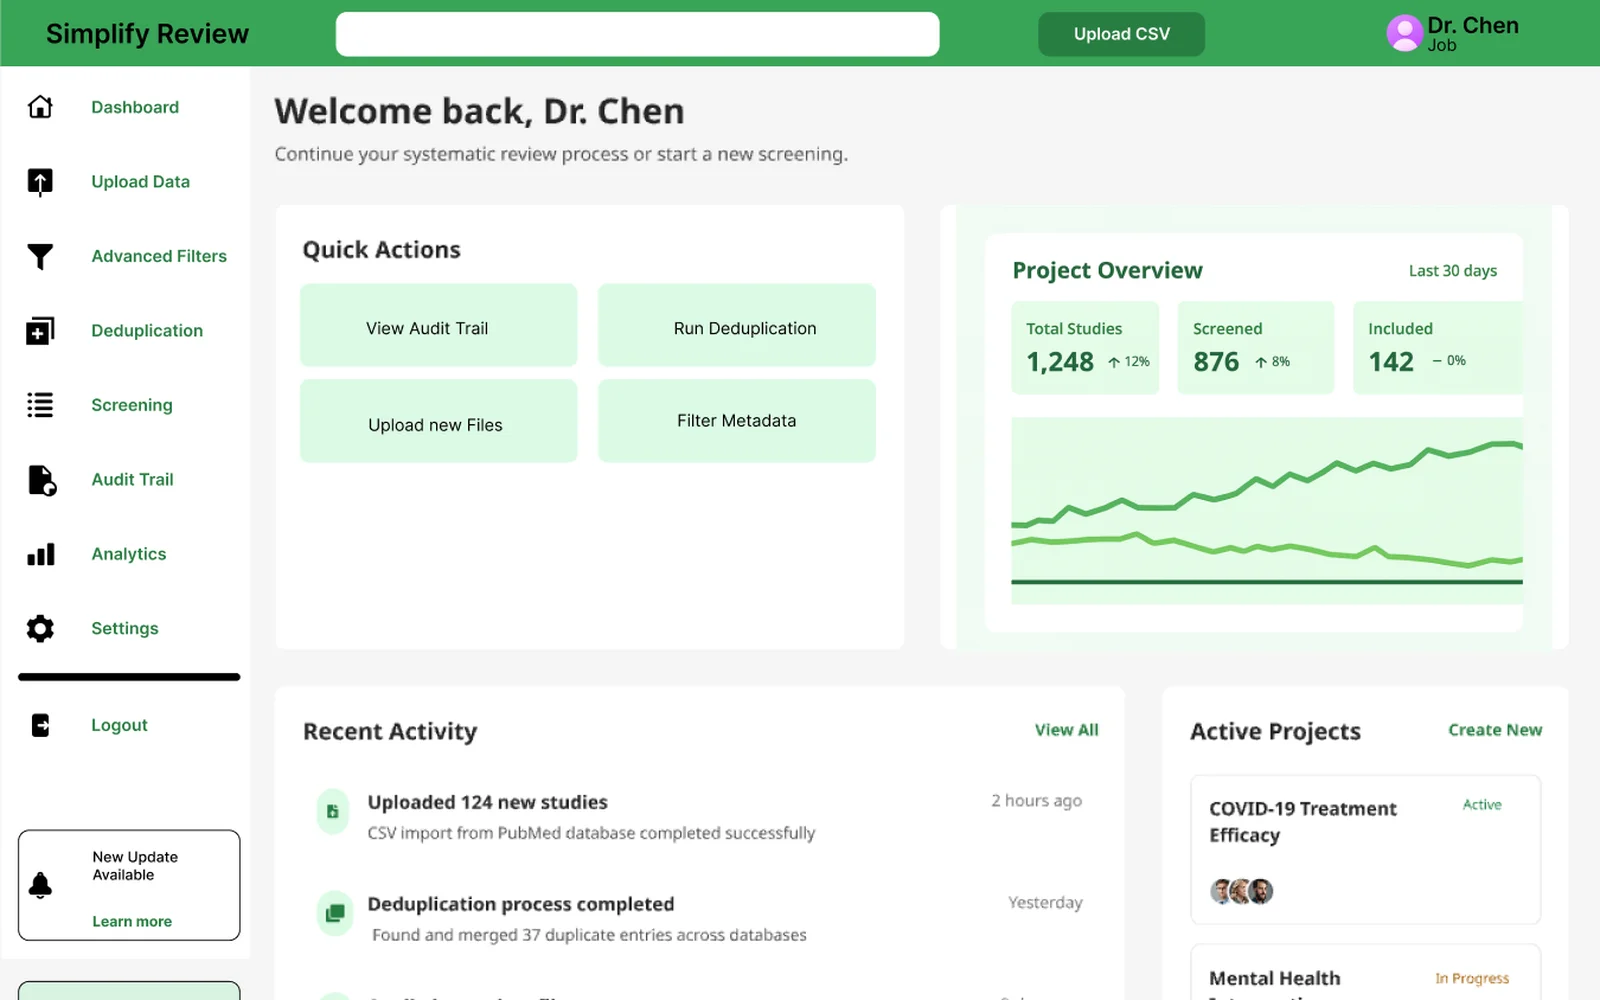 Thesis prototypeRefined
The refined screens have not yet been tested with users. The data shown are fictional examples.
- 01
Visible flow. The sidebar follows the real order of the work and shows the status of each stage: completed, in progress, to do.
- 02
PRISMA-style counters. On the dashboard: records identified, duplicates removed, records screened and included.
- 03
Explicit rules. The deduplication criteria are visible chips, with “Merge” and “Keep both” on each pair.
- 04
Immediate feedback. Removable active filters and a study count that updates while you choose.
- 05
Identity and accessibility. A logo, white text only on greens that are dark enough, and consistent status colours for included, excluded and stage.
- 06
Less noise. I removed the heavy dividers and the repeated boxes in the sidebar; there is only one contextual prompt.
A first step, with a clear direction
Towards systematic reviews that are more
Simplify Review is not an end point. The strongest contribution of the project is the method: user research, requirements, prototyping with increasing fidelity and evaluation, always with the researcher at the centre and with automation at their service.